Featured
1 2 3 4Elections Data Update
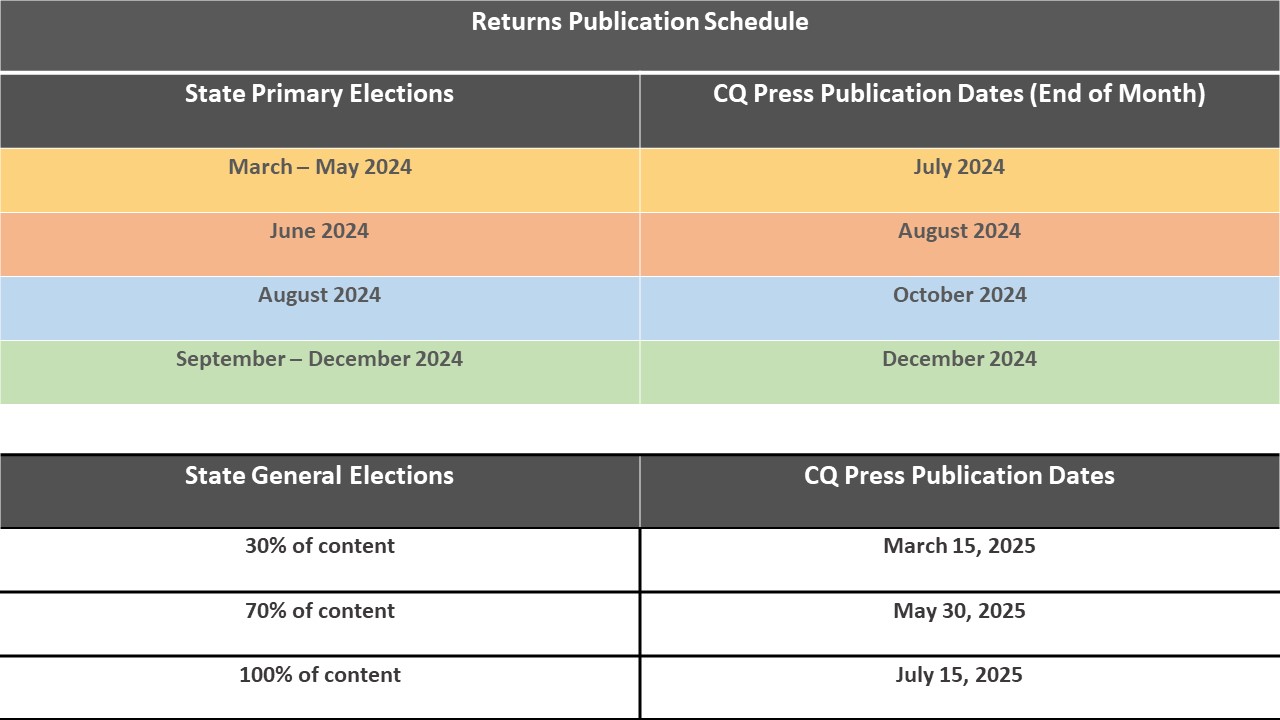
Our dedicated editorial staff spends many months gathering, cleaning, and updating primary and general election data as the states release their official results. We want to bring you this data as quickly as possible! See our publication schedule below.

Featured Report
The latest election news and analysis from voting and election experts
A Battleground County in a Battleground State: Firsthand Observations – January 8, 2025
Several years ago, in order to be closer to family, voting and elections expert Rhodes Cook and his wife moved several hundred miles northwestward from the Washington, D.C., suburbs to Grand Rapids, Michigan. In this Election Report, Cook describes his observations of relocating from a decidedly Democratic area to arguably the leading battleground county in a battleground state.